Unbalanced Forces Lab: Mass VS. aCCELERATION
By: Andy, Edward, Aditya K.
October 21, 2021
Research Question: How does the MASS of an object depend on the NET FORCE acting on it?
Variables
Independent - Mass (g)
Dependent - Acceleration (m/s^2)
Controls - Net Force (force of gravity on hanger), the track, mass of the cart
How did we control the variables?
In order to control our variables, we used the same track to make sure that the surface is the same and the friction is the same. Changes in the smoothness of the track could affect the friction between the track and the cart, thereby affecting the acceleration of the cart. We also have to make sure that we did not push the cart upon the release of the cart. A push would alter the acceleration and initial velocity of the cart. We kept the weight of the hanger the same to make sure that the net force of gravity on the hanger is the same. This allows us to test only the relationship between the mass on the cart and the acceleration.
Data Collection
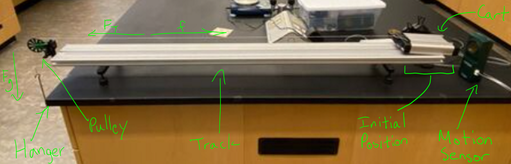
We placed the motion detector behind the track and aligned it perfectly with the path of the cart. Since we linked the motion detector to our computer and LoggerPro, we are able to see the velocity of the cart every 0.05 seconds. By using a line of best fit on an interval that represented the proper velocity of the cart, we could determine the acceleration of the cart. The slope of the velocity graph is the acceleration of the cart. We kept track of the acceleration of the cart as we increased the mass of on the cart.
Procedure
1. Place the motion detector behind the track
2. Place 500g on the cart and 50g on the hanger
3. Release the cart at the initial position and record the velocity
4. Add the weights on the cart so that the mass on the cart is 30g, 130g, 230g, 330g, 430g, 530g, 630g, 730g, 830g, 930g, 1030g, and 1930g
5. Keep the mass of the hanger constant throughout the entire experiment
6. Record the velocity of the cart at different masses
Independent - Mass (g)
Dependent - Acceleration (m/s^2)
Controls - Net Force (force of gravity on hanger), the track, mass of the cart
How did we control the variables?
In order to control our variables, we used the same track to make sure that the surface is the same and the friction is the same. Changes in the smoothness of the track could affect the friction between the track and the cart, thereby affecting the acceleration of the cart. We also have to make sure that we did not push the cart upon the release of the cart. A push would alter the acceleration and initial velocity of the cart. We kept the weight of the hanger the same to make sure that the net force of gravity on the hanger is the same. This allows us to test only the relationship between the mass on the cart and the acceleration.
Data Collection
We placed the motion detector behind the track and aligned it perfectly with the path of the cart. Since we linked the motion detector to our computer and LoggerPro, we are able to see the velocity of the cart every 0.05 seconds. By using a line of best fit on an interval that represented the proper velocity of the cart, we could determine the acceleration of the cart. The slope of the velocity graph is the acceleration of the cart. We kept track of the acceleration of the cart as we increased the mass of on the cart.
Procedure
1. Place the motion detector behind the track
2. Place 500g on the cart and 50g on the hanger
3. Release the cart at the initial position and record the velocity
4. Add the weights on the cart so that the mass on the cart is 30g, 130g, 230g, 330g, 430g, 530g, 630g, 730g, 830g, 930g, 1030g, and 1930g
5. Keep the mass of the hanger constant throughout the entire experiment
6. Record the velocity of the cart at different masses
Recorded Raw Data
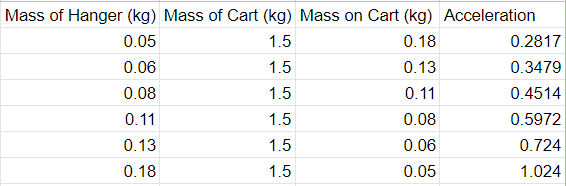
The raw data includes the mass of the hanger and the mass on the cart. The mass of the cart and the mass of the hanger stays the same, while weights are added onto the cart. The acceleration is recorded at the different masses using the motion sensor.
The raw data includes the mass of the hanger and the mass on the cart. The mass of the cart and the mass of the hanger stays the same, while weights are added onto the cart. The acceleration is recorded at the different masses using the motion sensor.
Processed Raw Data
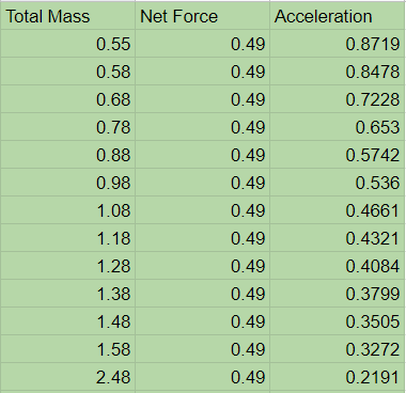
The total mass of the system is calculated by adding the mass of the cart with the mass on the cart and the mass of the hanger. The Net Force of the hanger is 9.8 (gravitational constant) times mass of hanger (kg). Since the mass of the hanger is constant, the net force is constant as well. Using Excel, I wrote a formula while allows me to automatically multiply the mass of the hanger by the gravitation force and find the total mass by adding the mass of the cart, mass on the cart, and the hanger together.
The total mass of the system is calculated by adding the mass of the cart with the mass on the cart and the mass of the hanger. The Net Force of the hanger is 9.8 (gravitational constant) times mass of hanger (kg). Since the mass of the hanger is constant, the net force is constant as well. Using Excel, I wrote a formula while allows me to automatically multiply the mass of the hanger by the gravitation force and find the total mass by adding the mass of the cart, mass on the cart, and the hanger together.
Presentation of Processed Data
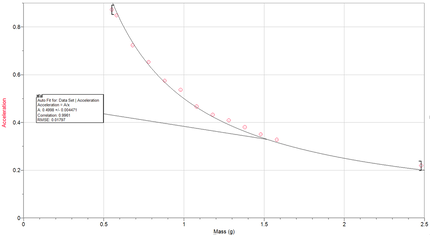
A nonlinear inverse model was used to show the relationship between mass (x-axis) and acceleration (y-axis). This curved fit demonstrates that acceleration = 0.4998/mass (y=A/x), where acceleration is in meters per second squared (m/s^2) and mass is in kilograms (kg). 0.4998 is the value of A in the graph. As mass approaches 0, acceleration approaches infinity, therefore there is no y-intercept. This tell us that there is negative correlation between mass and acceleration.
A nonlinear inverse model was used to show the relationship between mass (x-axis) and acceleration (y-axis). This curved fit demonstrates that acceleration = 0.4998/mass (y=A/x), where acceleration is in meters per second squared (m/s^2) and mass is in kilograms (kg). 0.4998 is the value of A in the graph. As mass approaches 0, acceleration approaches infinity, therefore there is no y-intercept. This tell us that there is negative correlation between mass and acceleration.
Conclusions
The goal of the experiment was to determine how the Mass affects Acceleration. Since we kept Net Force constant throughout the experiment, we were able to determine the relationship. As mass increases, an object is heavier and therefore harder to push or pull, thereby decreasing the acceleration. We could also see that the formula a = ΣF/m is similar to y = A/x. Mass was used for x, acceleration was used for y, and ΣF was constant similar to A. This tells us that there is an inverse relationship between mass and acceleration. This is consistent with Newton's 2nd law, which states that acceleration is inversely proportional to the mass of the system.
The goal of the experiment was to determine how the Mass affects Acceleration. Since we kept Net Force constant throughout the experiment, we were able to determine the relationship. As mass increases, an object is heavier and therefore harder to push or pull, thereby decreasing the acceleration. We could also see that the formula a = ΣF/m is similar to y = A/x. Mass was used for x, acceleration was used for y, and ΣF was constant similar to A. This tells us that there is an inverse relationship between mass and acceleration. This is consistent with Newton's 2nd law, which states that acceleration is inversely proportional to the mass of the system.
Evaluating Processes
One limitation to our experiment could be that since logger pro records every velocity at 0.05 seconds, its not as precise as can be. We also could have done better to ensure that the cart was released from the same initial position every time. Different initial positions may affect how fast the hanger pulls on the cart. Ultimately, there may be uncertainty in our data because we did not use repeated trials to obtain more accurate results.
One limitation to our experiment could be that since logger pro records every velocity at 0.05 seconds, its not as precise as can be. We also could have done better to ensure that the cart was released from the same initial position every time. Different initial positions may affect how fast the hanger pulls on the cart. Ultimately, there may be uncertainty in our data because we did not use repeated trials to obtain more accurate results.
Improvements
To improve this experiment, I could have used repeated trials to gain more accurate results. On top of that, I would also use a motion sensor that could pick up velocities at shorter or faster intervals. If we wanted to increase our range of data for the acceleration, we could have increased the weight of the hanger, which would also increase the constant net force.
To improve this experiment, I could have used repeated trials to gain more accurate results. On top of that, I would also use a motion sensor that could pick up velocities at shorter or faster intervals. If we wanted to increase our range of data for the acceleration, we could have increased the weight of the hanger, which would also increase the constant net force.
