Cart on Ramp lab
By: Andy, Gabby, Jack, Matt
September 24, 2021
September 24, 2021
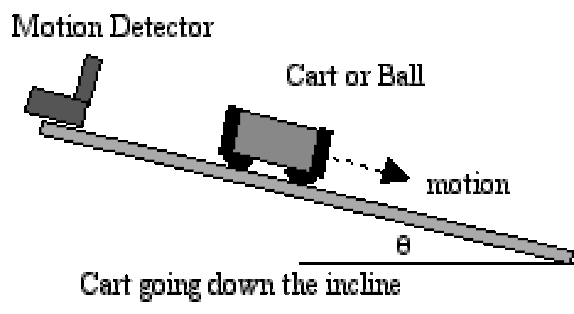
Research Question: How does time affect the position of a cart on a ramp?
Variables
Independent - Time (seconds)
Dependent - Position (meters)
Controls - The initial position, the force exerted on the cart
How did we control the variables?
In order to obtain an accurate representation of the correlation between the position and time of a cart on a ramp, we set the initial position of the cart at the top of the ramp. Therefore, the cart starts at a position x = 0 at the top of the ramp. We also made sure not to exert any force when letting the cart roll down the ramp. The velocity of the cart would have been altered if the cart was pushed instead of placed at the beginning of the experiment. Since there was only one trial, we did not have constant variables that we kept constant throughout the experiment.
Data Collection
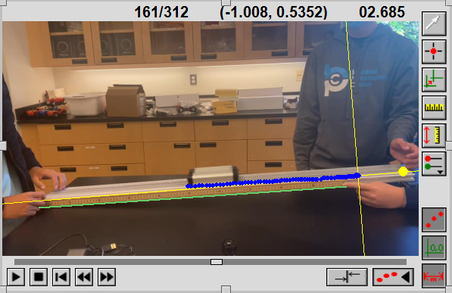
As it is very difficult to record the position of the cart as it speeds down the ramp at different times, we recorded a video of the cart going down the ramp. This allows for more accurate data by eliminating the potential errors caused by imperfect human reaction time. Then using LoggerPro, we were able to plot data points for the position with respect to time frame by frame. By placing a meter stick in the video, we were able to scale the video to match the actual length of the change in position of the cart.
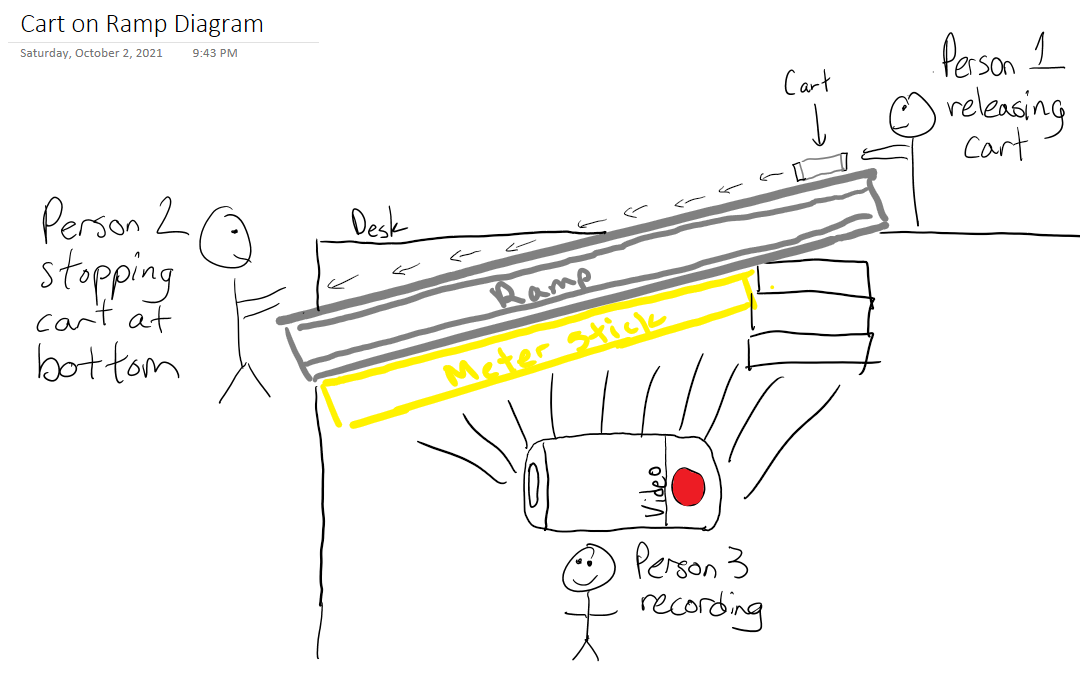
Procedure
1. Record the cart, ramp, and meter stick from the side in a way that allows us to see the both the cart's position and the meter stick
2. Place the cart at the top of the ramp (initial position)
3. Release the cart with no added force
4. Stop the cart at the bottom of the ramp
5. Save the video and upload it to LoggerPro
6. Enable video analysis
7. Set the origin
8. Set scale by using the meter stick in the video
9. Use the add point button to mark the position of the cart frame by frame
10. Add a linear fit line to the graph that appears from the collection of all the data points
Independent - Time (seconds)
Dependent - Position (meters)
Controls - The initial position, the force exerted on the cart
How did we control the variables?
In order to obtain an accurate representation of the correlation between the position and time of a cart on a ramp, we set the initial position of the cart at the top of the ramp. Therefore, the cart starts at a position x = 0 at the top of the ramp. We also made sure not to exert any force when letting the cart roll down the ramp. The velocity of the cart would have been altered if the cart was pushed instead of placed at the beginning of the experiment. Since there was only one trial, we did not have constant variables that we kept constant throughout the experiment.
Data Collection
As it is very difficult to record the position of the cart as it speeds down the ramp at different times, we recorded a video of the cart going down the ramp. This allows for more accurate data by eliminating the potential errors caused by imperfect human reaction time. Then using LoggerPro, we were able to plot data points for the position with respect to time frame by frame. By placing a meter stick in the video, we were able to scale the video to match the actual length of the change in position of the cart.
Procedure
1. Record the cart, ramp, and meter stick from the side in a way that allows us to see the both the cart's position and the meter stick
2. Place the cart at the top of the ramp (initial position)
3. Release the cart with no added force
4. Stop the cart at the bottom of the ramp
5. Save the video and upload it to LoggerPro
6. Enable video analysis
7. Set the origin
8. Set scale by using the meter stick in the video
9. Use the add point button to mark the position of the cart frame by frame
10. Add a linear fit line to the graph that appears from the collection of all the data points
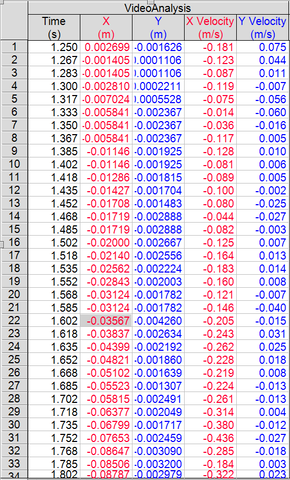
Raw Data
The raw data included the x and y positions at different times t. The raw data also gives the velocity of x and y and any given point. This demonstrates how much x and y are changing at different times.
Processed Data
There was only trial for the position of the cart. Therefore, no calculations were needed in order to process the data. However, a curved fit was added to the graph to help better visualize the data points.
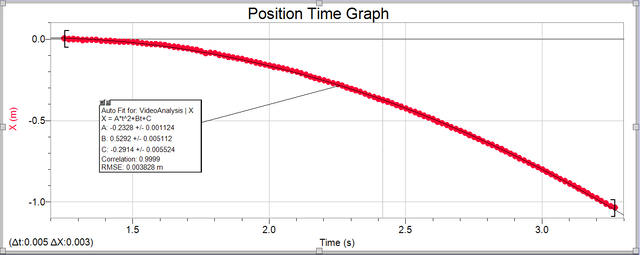
The position shows the position of the cart over time in seconds. The equation is x = -0.2338t^2 + 0.5292t - 0.2914. This graph is clearly a downward parabola. The y intercept demonstrates that the initial position at time t = 0 is -0.2914 meters. As time increases, the slope gets steeper and steeper. The cart is getting faster and faster. Therefore, the cart does not have a constant velocity as it moves down the ramp.
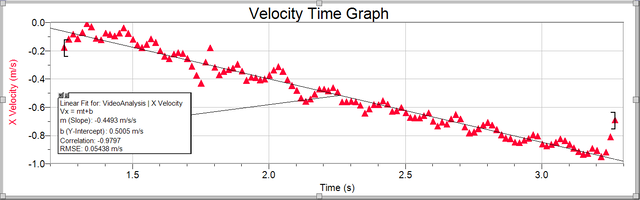
The velocity time graph shows that the velocity is decreasing at a constant rate. This tells us that the acceleration is constant for the cart. Since the velocity is negative, it means that the cart is moving towards the origin. Throughout the experiment we derived the equation Vf = a * Δt + Vi from the equation y = mx +b. This is because in the context of the velocity graph, y is velocity, x is time, and the acceleration is the slope. This equation allows us to find the final velocity using the acceleration, time, and initial velocity. On top of that, we can also find the acceleration by dividing the Δv by Δt.
Evidence to Conclusions
By using LoggerPro, we were able to find the equation of the cart. We discovered that the velocity of the cart is not constant as the cart moves down the ramp. Our velocity graph proved that the cart is accelerating as it moves down the ramp. This evidence tells us that an incline can increase the velocity of objects. With this new information we can now use our new model when applying physics to real world situations with object accelerating.
By using LoggerPro, we were able to find the equation of the cart. We discovered that the velocity of the cart is not constant as the cart moves down the ramp. Our velocity graph proved that the cart is accelerating as it moves down the ramp. This evidence tells us that an incline can increase the velocity of objects. With this new information we can now use our new model when applying physics to real world situations with object accelerating.
Conclusion
In the beginning of our experiment we were curious how the position of the cart changes with time. We soon realized that the velocity of the cart is very different than the velocity of the buggy during the buggy lab. While the cart accelerated, the buggy moved at a constant velocity. We concluded that it was because of the ramp that the cart had a change in velocity. The buggy moved along a flat surface, relying solely on its engines to propel it forward. Our graphs showed that while the cart created a downward quadratic graph, the buggy created a linear graph. As the slope of the position graph got steeper and steeper for the cart lab, it was clear that the velocity was changing. The slope of the position graph of the buggy lab remained constant throughout the entire experiment. Using our new knowledge about the relationship between velocity and acceleration, we were able to derive equations regarding acceleration and velocity. Acceleration is the slope of the velocity graph. By replacing different variables for the equation y = mx + b, we can derive a new formula the relationship between acceleration and velocity.
In the beginning of our experiment we were curious how the position of the cart changes with time. We soon realized that the velocity of the cart is very different than the velocity of the buggy during the buggy lab. While the cart accelerated, the buggy moved at a constant velocity. We concluded that it was because of the ramp that the cart had a change in velocity. The buggy moved along a flat surface, relying solely on its engines to propel it forward. Our graphs showed that while the cart created a downward quadratic graph, the buggy created a linear graph. As the slope of the position graph got steeper and steeper for the cart lab, it was clear that the velocity was changing. The slope of the position graph of the buggy lab remained constant throughout the entire experiment. Using our new knowledge about the relationship between velocity and acceleration, we were able to derive equations regarding acceleration and velocity. Acceleration is the slope of the velocity graph. By replacing different variables for the equation y = mx + b, we can derive a new formula the relationship between acceleration and velocity.
Evaluating Procedures
Even though we eliminated the errors that come with human reaction time, LoggerPro can be blurry at times, causing slight differences in data points. The data could be a little bit off of the actual positions because of inaccuracies of the pixels on a computer screen. Furthermore, it is possible that the person releasing the cart could have exerted some force, increasing the velocity of the cart. On top of that, we did not do repeated trials. However, since we collected a large amount of data points and a wide range of data, I feel confident that our data is accurate and close to the actual speed of the cart.
Even though we eliminated the errors that come with human reaction time, LoggerPro can be blurry at times, causing slight differences in data points. The data could be a little bit off of the actual positions because of inaccuracies of the pixels on a computer screen. Furthermore, it is possible that the person releasing the cart could have exerted some force, increasing the velocity of the cart. On top of that, we did not do repeated trials. However, since we collected a large amount of data points and a wide range of data, I feel confident that our data is accurate and close to the actual speed of the cart.
Improvement
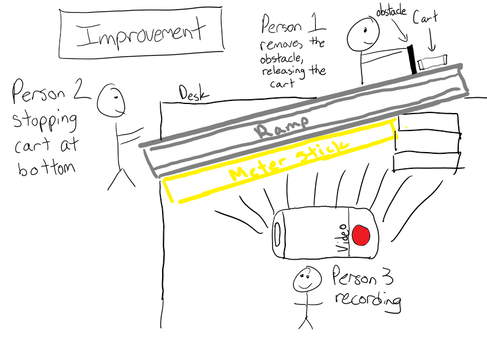
One improvement we could have made is make the ramp longer to allow for the cart to run longer. This way we would have an even wide range of data to ensure that the cart reaches its maximum velocity. On top of that, we could find a way to ensure that no force is added to the cart upon release. An example of that is using something block the path of the cart, and then removing the obstacle when the timer begins. This way the cart is not acted upon by any force.
One improvement we could have made is make the ramp longer to allow for the cart to run longer. This way we would have an even wide range of data to ensure that the cart reaches its maximum velocity. On top of that, we could find a way to ensure that no force is added to the cart upon release. An example of that is using something block the path of the cart, and then removing the obstacle when the timer begins. This way the cart is not acted upon by any force.
