Buggy Lab
By: Andy, Luke, Aayush
September 14, 2021
Research Question: How does time affect the position of the Buggy?
Variables
Independent - Time (seconds)
Dependent - Position (centimeters)
Controls - Buggy (speed + weight + height), Track, Environment, Initial Position
How did we control the variables?
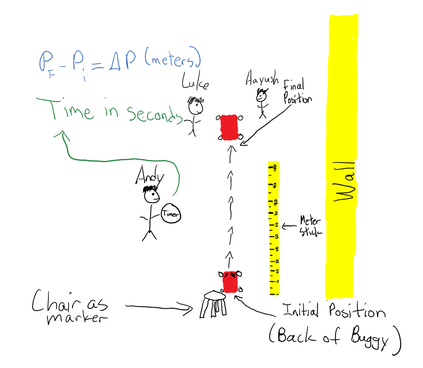
In order to control our variables, we made sure to have the same materials throughout data collection. To ensure that the weight and speed of the buggy was the same every time, we used the same Buggy every time. We also made the Buggy follow the same path each time to account for the differences that may result from the terrain. We also made sure that the initial point was always the same to decrease variation caused from different starting points. The temperature and the wind speed in the room was kept constant since the environment was unchanged. We also started at same starting point. In order to limit the margin of error that results from human reaction, we made sure each person did the same role for the experiment every time. I timed the Buggy. Aayush and Luke stopped and turned off the Buggy when the time was reached.
Data Collection
For the goal of obtaining sufficient and relevant data, we made sure to collect a wide range of data and many data points. The time ranged from 1 second to 20 seconds. In total between 1 and 20 seconds, we had tests for 6 different times. We also repeated the experiment multiple times for every time to ensure good quality data. Repeated trials is important for increasing our confidence in our data.
Procedure
1. Place Buggy at Initial Position
2. Determine the amount of seconds that the Buggy will run for
3. Turn on Buggy and start the timer at the same time
4. When the timer is done, turn off the Buggy and mark the location
5. Measure the distance between the Buggy and the Initial Position
6. Record the data in a table with times (seconds) and position (centimeters)
7. Repeat trials at least two times to ensure accurate data
Independent - Time (seconds)
Dependent - Position (centimeters)
Controls - Buggy (speed + weight + height), Track, Environment, Initial Position
How did we control the variables?
In order to control our variables, we made sure to have the same materials throughout data collection. To ensure that the weight and speed of the buggy was the same every time, we used the same Buggy every time. We also made the Buggy follow the same path each time to account for the differences that may result from the terrain. We also made sure that the initial point was always the same to decrease variation caused from different starting points. The temperature and the wind speed in the room was kept constant since the environment was unchanged. We also started at same starting point. In order to limit the margin of error that results from human reaction, we made sure each person did the same role for the experiment every time. I timed the Buggy. Aayush and Luke stopped and turned off the Buggy when the time was reached.
Data Collection
For the goal of obtaining sufficient and relevant data, we made sure to collect a wide range of data and many data points. The time ranged from 1 second to 20 seconds. In total between 1 and 20 seconds, we had tests for 6 different times. We also repeated the experiment multiple times for every time to ensure good quality data. Repeated trials is important for increasing our confidence in our data.
Procedure
1. Place Buggy at Initial Position
2. Determine the amount of seconds that the Buggy will run for
3. Turn on Buggy and start the timer at the same time
4. When the timer is done, turn off the Buggy and mark the location
5. Measure the distance between the Buggy and the Initial Position
6. Record the data in a table with times (seconds) and position (centimeters)
7. Repeat trials at least two times to ensure accurate data
Recorded Raw Data
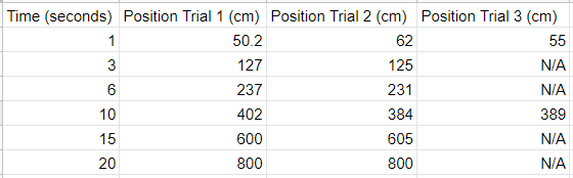
There were uncertainties in our data collection due our reaction time. As a result, repeated trials were needed for most times. Some trials even required a third trial to ensure that there are no outliers in the data.
There were uncertainties in our data collection due our reaction time. As a result, repeated trials were needed for most times. Some trials even required a third trial to ensure that there are no outliers in the data.
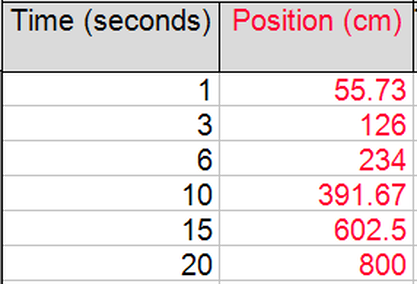
Processed Raw Data
We averaged out the different data points to obtain the average position (cm) for each individual time (seconds). We used multiple trials to account for uncertainties in the data.
For example when we have two data points at time = 3 seconds
(127 + 125) / 2 = 126
And when we had three data points at time = 10 seconds
(402 + 384 + 389) / 3 = 391.67
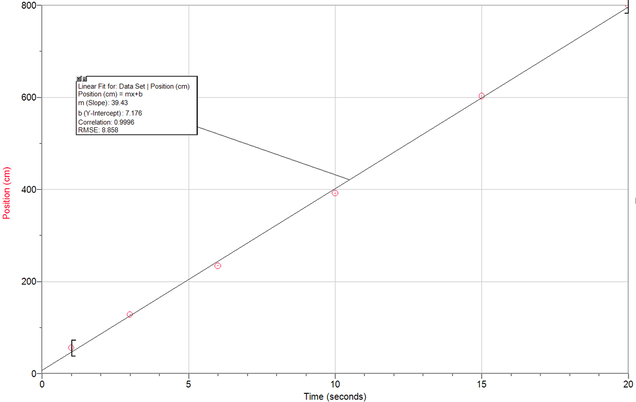
Presentation of Processed Data
This line of best fit demonstrates the position of the buggy as time increases. x = 39.43t + 7.176. X stands for the position while t stands for time. The slope demonstrates the increase in position when time increases by one second. The y-intercept shows the position of Buggy at time = 0 seconds. The velocity of the Buggy can be found by taking the derivative of the position function. As a result you get v = 39.43, which means that the Buggy travels 39.43 cm in a second.
This line of best fit demonstrates the position of the buggy as time increases. x = 39.43t + 7.176. X stands for the position while t stands for time. The slope demonstrates the increase in position when time increases by one second. The y-intercept shows the position of Buggy at time = 0 seconds. The velocity of the Buggy can be found by taking the derivative of the position function. As a result you get v = 39.43, which means that the Buggy travels 39.43 cm in a second.
Conclusions
The goal of our experiment was to discover how position is affected by time. By collecting and plotting the data, we were able to determine that the position of the Buggy over time follows a linear model. Furthermore, when we used a line of best fit, we obtained an equation with information regarding the slope and y-intercept. The equation is x = 39.43t + 0.716. The slope 39.43 tells us that every second that passes, the Buggy moves 39.43 centimeters. This slope is also the velocity of the Buggy. This line of best fit can also help us estimate the final position in relationship to time and the initial position. The relationship between the position and time can also be expressed by the formula xf = v * Δt +xi, where v = velocity/slope and Δt = change in time. With this equal we are able to figure out the final position, initial position, velocity, and time as long we have the other variables. This experiment has given us insight on how the variables involved in movement are related to each other. Since the Buggy traveled at a constant pace, we can determine the position of the Buggy at any time t.
The goal of our experiment was to discover how position is affected by time. By collecting and plotting the data, we were able to determine that the position of the Buggy over time follows a linear model. Furthermore, when we used a line of best fit, we obtained an equation with information regarding the slope and y-intercept. The equation is x = 39.43t + 0.716. The slope 39.43 tells us that every second that passes, the Buggy moves 39.43 centimeters. This slope is also the velocity of the Buggy. This line of best fit can also help us estimate the final position in relationship to time and the initial position. The relationship between the position and time can also be expressed by the formula xf = v * Δt +xi, where v = velocity/slope and Δt = change in time. With this equal we are able to figure out the final position, initial position, velocity, and time as long we have the other variables. This experiment has given us insight on how the variables involved in movement are related to each other. Since the Buggy traveled at a constant pace, we can determine the position of the Buggy at any time t.
Evaluating Processes
One limitation of our investigation was the length of the meter sticks. When we were measuring the distance that the Buggy traveled, we had to place multiple meter sticks side by side in order to reach the Buggy. There slight deviations from the real distance if the meter sticks were not aligned perfectly with each other. On top of that the Buggy would often not go in a straight line, which could cause the terrain that the Buggy moved on to vary from trial to trial. However, the most important limitation to our investigation was the reaction time of humans. For us to stop the Buggy at the designated time, the person who was timing would have to pause at the exact time. Even after that, there is a delay in the people stopping the Buggy because have to hear the person with the timer say stop. Despite these uncertainties, because we used a wide range of data, multiple data points, and repeated trials, I feel confident in our data is very close to the actual speed of the Buggy.
One limitation of our investigation was the length of the meter sticks. When we were measuring the distance that the Buggy traveled, we had to place multiple meter sticks side by side in order to reach the Buggy. There slight deviations from the real distance if the meter sticks were not aligned perfectly with each other. On top of that the Buggy would often not go in a straight line, which could cause the terrain that the Buggy moved on to vary from trial to trial. However, the most important limitation to our investigation was the reaction time of humans. For us to stop the Buggy at the designated time, the person who was timing would have to pause at the exact time. Even after that, there is a delay in the people stopping the Buggy because have to hear the person with the timer say stop. Despite these uncertainties, because we used a wide range of data, multiple data points, and repeated trials, I feel confident in our data is very close to the actual speed of the Buggy.
Improvements
An alternative method that we could have used is placing the meter sticks down first, and then recording the Buggy as it travels next to the meter sticks. While this will take considerable time and effort, it will allow us to eliminate the uncertainty of human reaction time. By viewing the Buggy traveling through a video, we can slow down the video and pause the video when the timer is up. And because the meter sticks were placed down ahead of time, we would not need to worry about how the meter sticks were aligned together.
An alternative method that we could have used is placing the meter sticks down first, and then recording the Buggy as it travels next to the meter sticks. While this will take considerable time and effort, it will allow us to eliminate the uncertainty of human reaction time. By viewing the Buggy traveling through a video, we can slow down the video and pause the video when the timer is up. And because the meter sticks were placed down ahead of time, we would not need to worry about how the meter sticks were aligned together.
